
Vectorize Excel Workflows with Python
Excel has long been the preferred tool for business reporting and data analysis, but modern organizations generate data from multiple sources that spreadsheets cannot efficiently manage. Learning to vectorize Excel workflows with Python replaces manual formulas and repetitive tasks with automated, scalable pipelines.
Combined with Python data pipeline automation and Pandas optimization, this approach improves reporting speed, accuracy, and efficiency while helping Excel users transition into modern data analytics and build future-ready technical skills.
What Does It Mean to Vectorize Excel Workflows?
Vectorizing Excel workflows means replacing manual spreadsheet formulas, repetitive copy-paste tasks, and row-by-row calculations with Python code that processes entire datasets simultaneously. Instead of performing calculations cell by cell, Python libraries such as Pandas and NumPy apply operations across complete columns or tables in one step. This approach enables businesses to automate reporting, integrate multiple data sources, improve processing speed, and build scalable analytics workflows that are easier to maintain.
Why Legacy Excel Pipelines Are No Longer Enough
For many businesses, Excel remains an essential reporting tool. However, as organizations collect larger volumes of structured and unstructured data, spreadsheet-based workflows become difficult to manage. Manual processes consume valuable time, increase the risk of errors, and make collaboration more challenging.
Common limitations of legacy Excel pipelines include:
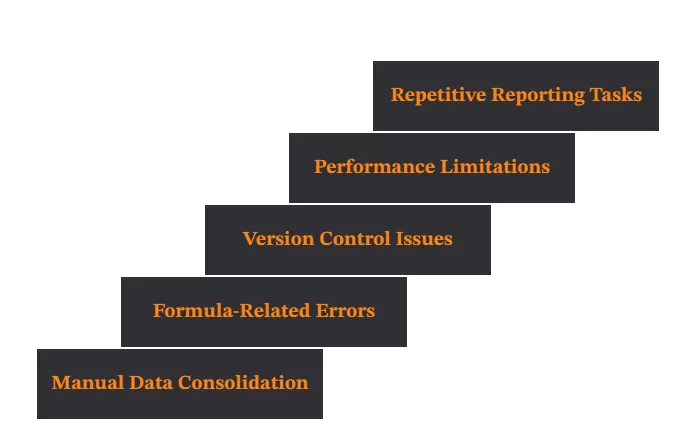
- Manual data consolidation: Employees often spend hours copying and pasting information from multiple spreadsheets, CSV files, or reports into a single workbook. This repetitive task slows productivity and increases the likelihood of human error.
- Formula-related errors: A single incorrect formula or accidental modification can affect thousands of calculations. These mistakes often go unnoticed until reports have already been shared with stakeholders.
- Version control issues: Multiple copies of the same workbook frequently create confusion about which file contains the latest information. This makes collaboration difficult and can result in inconsistent reporting.
- Performance limitations: Excel performs well with smaller datasets, but workbooks containing hundreds of thousands of rows often become slow, unstable, and difficult to maintain.
- Repetitive reporting tasks: Weekly and monthly reporting requires analysts to repeat the same manual process repeatedly. Automation eliminates this repetitive effort and allows teams to focus on generating business insights instead.
These limitations explain why organizations are increasingly replacing spreadsheet-driven workflows with automated Python solutions.
Excel vs Python: Which Is Better for Modern Data Pipelines?
Excel continues to be an excellent tool for ad hoc analysis, budgeting, and quick reporting. However, Python is designed to automate repetitive processes, integrate multiple data sources, and process significantly larger datasets. Rather than replacing Excel entirely, Python complements it by handling data preparation and automation while Excel remains useful for presenting final reports when required.
| Feature | Excel | Python |
|---|---|---|
| Data Processing | Suitable for small to medium datasets | Handles millions of records efficiently |
| Automation | Limited automation | Fully automated workflows |
| SQL Connectivity | Basic support | Native integration |
| API Integration | Limited | Extensive support |
| Reporting | Mostly manual | Scheduled and automated |
| Collaboration | Workbook sharing | Git-based version control |
| Scalability | Moderate | Enterprise-level scalability |
Businesses that combine Excel’s reporting capabilities with Python’s automation gain the flexibility to manage growing data volumes without increasing manual effort.
Building Multi-Source Vector Pipelines
Modern organizations rarely rely on a single spreadsheet for business reporting. Instead, valuable information is stored across multiple systems that must be combined before analysis. Python simplifies this process by creating automated pipelines that collect, clean, transform, and merge data from various sources.
Organizations that vectorize Excel workflows can seamlessly connect spreadsheets with SQL databases, APIs, cloud storage, and enterprise applications, creating a unified and automated reporting ecosystem.
A Python pipeline can integrate data from:
- Excel workbooks: Existing spreadsheets can be imported directly into Python, allowing organizations to modernize workflows without abandoning familiar reporting formats.
- CSV files: Python combines multiple CSV datasets quickly and efficiently, even when they contain millions of records that exceed Excel’s practical limits.
- SQL databases: Analysts can retrieve live business data directly from relational databases instead of exporting reports manually every day.
- REST APIs: Python automatically collects real-time information from CRM systems, ERP platforms, finance applications, and cloud services through secure API connections.
- Cloud storage services: Files stored on cloud platforms can be downloaded and processed automatically, eliminating repetitive manual file transfers.
- ERP and CRM platforms: Enterprise systems become reliable sources for automated dashboards, reporting, and advanced analytics, ensuring that business decisions are based on the latest available information.
How Python Data Pipeline Automation Improves Productivity?
One of the biggest advantages of Python data pipeline automation is its ability to eliminate repetitive reporting tasks. Instead of manually downloading reports, cleaning datasets, applying formulas, and updating dashboards, analysts can automate the entire workflow using Python scripts. This allows organizations to process data faster, reduce errors, and focus more on business insights than manual data preparation. Organizations that vectorize Excel workflows automate repetitive tasks, improve reporting speed, and reduce manual errors.
Python can automate several business processes, including:
- Collecting data from multiple sources: Python automatically gathers data from Excel, SQL databases, APIs, cloud storage, and enterprise systems, ensuring reports always use the latest information.
- Cleaning and validating datasets: It removes duplicates, fixes missing values, standardizes formats, and validates data to improve report accuracy.
- Generating dashboards and reports: Python automatically creates KPI reports, summary tables, and visualizations using predefined workflows for consistent reporting.
- Scheduling recurring workflows: Reports can be scheduled to run daily, weekly, or monthly, eliminating repetitive manual tasks.
- Reducing operational errors: Automation minimizes copy-paste mistakes, broken formulas, and inconsistent calculations, resulting in more reliable reports.
Why Pandas Optimization Matters?
As businesses process increasingly larger datasets, performance becomes just as important as accuracy. Pandas optimization helps analysts work efficiently with millions of records while minimizing memory usage and execution time. By applying vectorized operations instead of traditional loops, Pandas performs calculations much faster than spreadsheet formulas.
Some of the most effective Pandas optimization techniques include:
- Using vectorized operations: Processing entire columns at once is much faster than row-by-row calculations, significantly improving performance.
- Choosing efficient data types: Selecting the right data types reduces memory usage and speeds up data processing.
- Optimizing filtering and grouping: Built-in Pandas functions quickly filter, sort, and aggregate data without complex spreadsheet formulas.
- Managing indexes effectively: Proper indexing speeds up data retrieval and improves joins and merge operations.
- Avoiding unnecessary loops: Using native Pandas functions instead of custom loops maximises performance and keeps code efficient.
Real-World Example of a Vectorized Pipeline
Consider a retail company that receives daily sales reports from ten regional stores. Traditionally, an analyst would download every Excel workbook, copy the data into a master spreadsheet, remove duplicate records, apply formulas, calculate daily KPIs, and email the updated report. This process could easily consume several hours each day.
With Python, the entire workflow becomes automated. The pipeline retrieves reports from cloud storage, imports inventory data from a SQL database, collects customer information through APIs, cleans and validates the datasets, applies vectorized transformations using Pandas, generates dashboards, and emails the final report before the business day begins. What once required hours of manual effort is completed in just a few minutes.
Tools and Technologies You’ll Learn
Building modern data pipelines requires more than Python alone. Analysts should become familiar with the ecosystem of tools that support automation, data processing, and reporting.
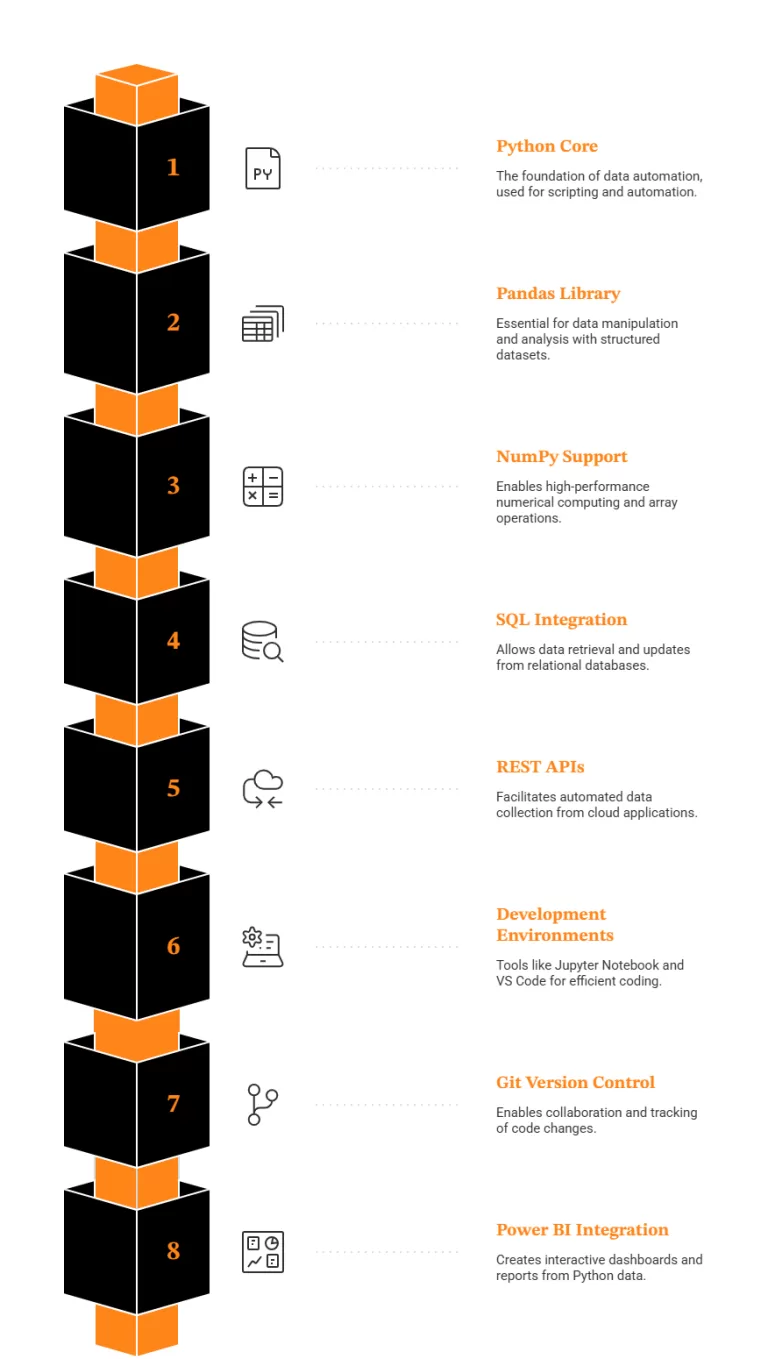
- Python: The core programming language used to automate data collection, transformation, and reporting workflows.
- Pandas: A powerful library for cleaning, transforming, merging, and analyzing structured datasets using vectorized operations.
- NumPy: Supports high-performance numerical computing and enables efficient array-based calculations.
- SQL: Allows analysts to retrieve and update information stored in relational databases.
- REST APIs: Enable automated data collection from cloud applications, CRM systems, ERP platforms, and online services.
- Jupyter Notebook and VS Code: These development environments help professionals write, test, and debug Python code efficiently.
- Git: Version control allows teams to collaborate on Python projects while tracking changes and maintaining code quality.
- Power BI: Python integrates seamlessly with Power BI to create interactive dashboards and business intelligence reports.
Learning Roadmap: From Excel User to Python Data Analyst
Transitioning from Excel to Python is easier when you follow a structured learning plan. Rather than trying to learn everything at once, build your skills step by step.
| Timeline | Skills to Learn |
|---|---|
| Month 1 | Python basics, variables, loops, functions |
| Month 2 | Pandas, NumPy, Excel automation, data cleaning |
| Month 3 | SQL, APIs, data transformation |
| Month 4 | Workflow automation and dashboard development |
| Month 5 | Pandas optimization and performance tuning |
| Month 6 | End-to-end projects and portfolio building |
As you progress through this roadmap, you’ll gain the practical skills needed to vectorize Excel workflows and automate end-to-end business reporting using Python.
Career Opportunities After Learning Python
Learning Python creates opportunities beyond traditional spreadsheet reporting. Organizations across industries seek professionals who can automate workflows, analyze large datasets, and build scalable reporting solutions.
A typical career progression looks like this:
Excel Analyst → Business Analyst → Python Data Analyst → Senior Data Analyst → Analytics Engineer → Data Engineer
Each stage builds upon the previous one by introducing more advanced automation, database management, and analytics responsibilities.
Move Beyond Excel with Python
Traditional spreadsheets are no longer enough for managing today’s growing and complex datasets. By learning to vectorize Excel workflows using Python data pipeline automation and Pandas optimization, you can automate repetitive tasks, improve reporting accuracy, and build scalable analytics solutions. Organizations that vectorize Excel workflows gain a competitive advantage by reducing manual effort, improving data accuracy, and delivering faster business insights through automation.
Ready to Make the Transition?
BDT’s Advancing into Data Analytics from Excel to Python public training program provides hands-on experience with Python, Pandas, workflow automation, and real-world projects to help you confidently advance your data analytics career.
FAQ
1. What does it mean to vectorize Excel workflows?
Vectorizing Excel workflows means replacing repetitive spreadsheet tasks such as formulas, copy-paste operations, and manual calculations with Python code that processes entire datasets simultaneously. By using libraries like Pandas and NumPy, organizations can automate reporting, improve processing speed, and create scalable workflows that are easier to maintain than traditional spreadsheets.
2. Why is Python better than Excel for large datasets?
Python is designed to process millions of records efficiently, whereas Excel can become slow and unstable with large datasets. Python also supports automation, SQL databases, APIs, cloud platforms, and advanced analytics, making it a more suitable solution for enterprise reporting and business intelligence while reducing manual effort.
3. What is Python data pipeline automation?
Python data pipeline automation refers to using Python scripts to automatically collect, clean, transform, merge, and deliver data from multiple sources. Instead of manually preparing reports, businesses can schedule automated workflows that generate accurate dashboards and reports using the latest available data.
4. How does Pandas optimization improve performance?
Pandas optimization improves performance by using vectorized operations, efficient data types, optimized filtering, and proper indexing techniques. These best practices reduce execution time, minimize memory consumption, and enable analysts to process significantly larger datasets than traditional spreadsheet-based methods.
5. Can Python completely replace Excel?
Python can automate most reporting, data cleaning, and transformation tasks traditionally performed in Excel. However, Excel remains valuable for quick calculations, ad hoc analysis, and presenting final reports. Many organizations use Python for backend data processing while continuing to use Excel as a familiar reporting interface.